Cape Coral September Market Update –Josh Bohling - LPT Realty SW FL

SW Florida September Market Update – Cape Coral | Josh Bohling - LPT Realty SW FL
But the local numbers tell the real story...
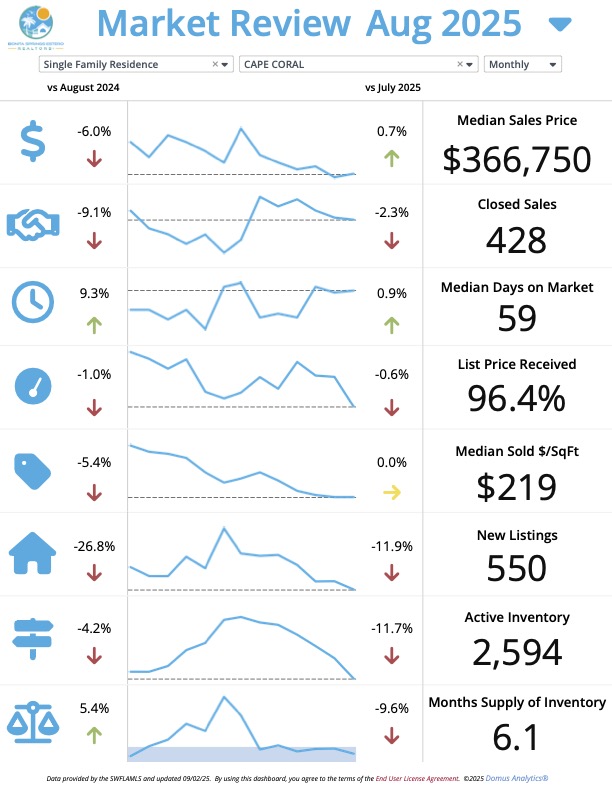
📍 Cape Coral – Single Family Homes (August 2025 vs 2024)
📈 Closed sales: 434 (down 7.9% vs Aug 2024)
📦 Active inventory: 2,604 (down 3.8% vs Aug 2024)
🏡 New listings: 550 (down 26.8% vs Aug 2024)
💵 Median sales price: $368,000 (down 5.6% vs Aug 2024)
📉 Median Sold $/SqFt: $219 (down 5.2% vs Aug 2024)
⏳ Median days on market: 59 (up 11.1% vs Aug 2024)
📊 Months of supply: 6.0 (up 4.4% vs Aug 2024)
🔻 List-to-sale ratio: 96.6% (down 0.8% vs Aug 2024)
✅ Takeaway: The single-family market in Cape Coral shows a mixed trend. While there's a general cooling with decreases in sales and new listings year-over-year, there's some resilience with a slight month-over-month increase in median sales price. The reduction in active inventory and months of supply from August 2024 to August 2025 could signal a tightening of available homes, despite the overall year-over-year decline in sales.
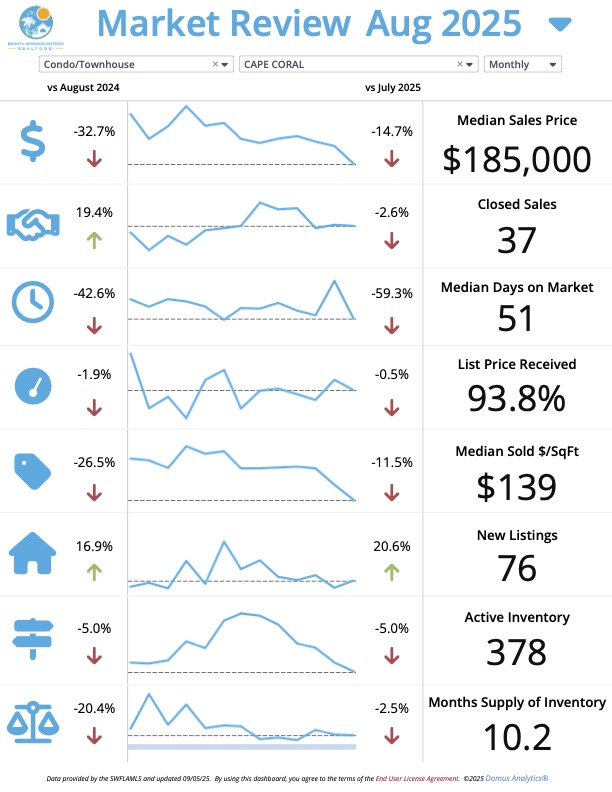
📍 Cape Coral – Condos & Townhouses (August 2025 vs 2024)
📈 Closed sales: 37 (up 19.4% vs Aug 2024)
📦 Active inventory: 378 (down 5.0% vs Aug 2024)
🏡 New listings: 76 (up 16.9% vs Aug 2024)
💵 Median sales price: $185,000 (down 32.7% vs Aug 2024)
📉 Median Sold $/SqFt: $139 (down 26.5% vs Aug 2024)
⏳ Median days on market: 51 (down 42.6% vs Aug 2024)
📊 Months of supply: 10.2 (down 20.4% vs Aug 2024)
🔻 List-to-sale ratio: 93.8% (down 1.9% vs Aug 2024)
✅ Takeaway: The Cape Coral condo/townhouse market shows a dynamic and somewhat contradictory picture. While median sales prices and sold price per square foot have seen significant declines, suggesting a buyer-friendly environment in terms of cost, the substantial decrease in median days on market indicates that properties are selling much faster. The increase in new listings and closed sales (year-over-year) also points to continued activity in this segment, despite the price adjustments.
🧠 What Does It All Mean?
Single Family Homes → The Cape Coral single-family market shows a mixed trend. While year-over-year comparisons indicate a cooling with decreases in sales and new listings, the month-over-month data suggests some resilience, with a slight increase in median sales price and stable median sold price per square foot. The reduction in active inventory and months of supply from July to August could signal a tightening of available homes, despite the overall year-over-year decline in sales.
Condos/Townhomes → The Cape Coral condo/townhouse market presents a dynamic and somewhat contradictory picture. While median sales prices and sold price per square foot have seen significant declines, suggesting a buyer-friendly environment in terms of cost, the substantial decrease in median days on market indicates that properties are selling much faster. The increase in new listings and closed sales (year-over-year) also points to continued activity in this segment, despite the price adjustments.
📞 Thinking about making a move in Southwest Florida? Let’s talk strategy and find the right fit for you.
---
Josh Bohling
📍 LPT Realty | Southwest Florida
📲 239-320-5326 (Call or Text)
Categories
- All Blogs (180)
- Bonita Springs (12)
- Cape Coral Real Estate (16)
- Charlotte County (2)
- Estero (12)
- First-Time Buyers (18)
- Fort Myers (20)
- Fort Myers Beach (12)
- Golf Community (5)
- Home Buying (90)
- Home Selling (38)
- Insurance (2)
- Investment Properties (3)
- Lehigh Acres (12)
- Marco Island (7)
- Market Update (125)
- Mortgage (4)
- Naples (20)
- Neighborhood Guides (30)
- North Fort Myers (7)
- North Port (3)
- Port Charlotte (4)
- Punta Gorda (4)
- Sanibel (12)
- Waterfront Properties (2)
Recent Posts


GET MORE INFORMATION